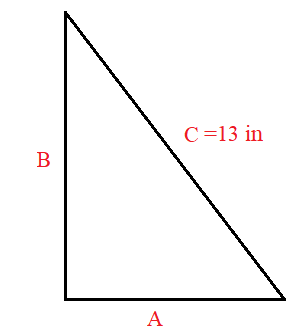
The hypotenuse (side C) of a triangle is 13 inches long. Which of the following pairs of measurements could be the correct for the lengths of the other two sides of the triangle? (Note: A2 + B2= C2)
A. 5 inches, 12 inches
B. 2.5 inches, 6 inches
C. 2.5 inches, 4 inches
D. 5 inches, 8 inches
This question was extracted from the actual TEAS 7 Exam. Get access to the actual TEAS 7 Exams (past and recent) on ExamGates.
In this problem, we take the triangle as a right-angled triangle and label it as follows:
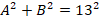
From the Pythagoras theorem A2 + B2= C2, we can look for a combination of A and B that when the squares of A and B are summed give a square of 13. Mathematically,

But C=13 inches
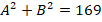
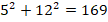
If we take A=5 inches and B=12 inches, then


Next, we take A=2.5 inches, B=6 inches


Next, we take A=2.5 inches, B=4 inches

6.25+16=169
22.25≠169
Taking A=5 inches and B=8 inches


From the above computation, the combination of A=5 inches and B=12 inches give a triangle with a hypothenuse of 13 inches.
Therefore, the Correct Answer is A.
More Questions on TEAS 7 Math Exam 1
Question 1:
Using the table below, which of the following statements describes the relationship between days and dollars?
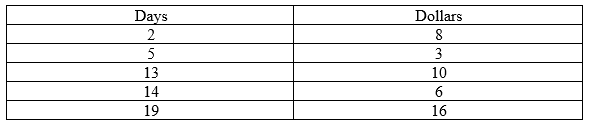
A. There is a positive correlation between days and dollars
B. There is a negative correlation between days and dollars
C. There is an inverse correlation between days and dollars
D. There is no correlation between days and dollars
The Correct Answer is D.To answer this question, we need to observe the trend of the number of days with dollars. On day 2, the dollars were 8, after 5 days, the dollars decreased to 3, after 13 days, the dollars increased to 10. After 14 days, the dollars declined to 6 and again rose to 16 dollars after 19 days.
From this observation, we cannot be able to establish any correlation between days and dollars.
Question 2:
A survey of 500 teenagers was taken to see which sport was the favorite to watch on television. The pie chart above represents the results. Which of the following data sets (number of teenagers) was used to develop the pie chart?
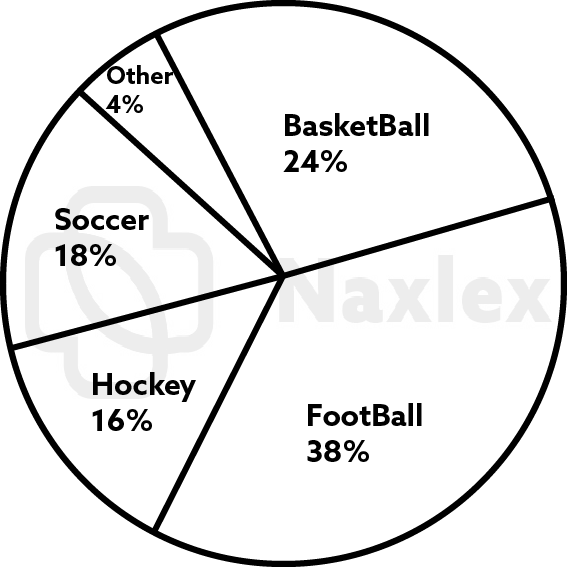
A. Basketball, 120: football, 190: hockey, 90: soccer, 80: other 20
B. Basketball, 120: football, 190: hockey, 80: soccer, 90: other 20
C. Basketball, 190: football, 120: hockey, 90: soccer, 80: other 20
D. Basketball, 240: football, 380: hockey 160: soccer, 180: other 40
The Correct Answer is B.The whole pie chart represents 100%, which we use together with the given percentages to find the respective different sports. Note that 100% is equal to 500 surveyed students. The, the number of teenagers who prefer:
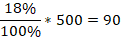
Soccer
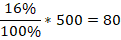
Hockey
Football
Basketball
Other
From the evaluations above, 90 teenagers love soccer, 80 love hockey, 190 teenagers love football, 120 teenagers love basketball, and 20 teenagers love others.
Question 3:
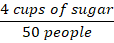
A pudding recipe for 50 people calls for 4 cups of sugar. Each bag of sugar contains 6 cups. How many bags of sugar will be needed to make this recipe for 300 people?
A. 8 bags
B. 13 bags
C. 4 bags
D. 24 bags
The Correct Answer is C.We need to perform a series of numerical dimensional analysis to find the number of bags sugar needed for 300 people.
We are told that 50 people need 4 cups of sugar. This can be interpretated as:
Or
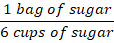
Also, one bag of sugar contains 6 cups. This can also be presented as:
Or
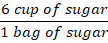
We use the second option relating number of people and cups, and second option relating cups of sugar and bag of sugar to find for number of bags of sugar needed for 300 people.

Therefore, 300 people will need 4 bags of sugar.
Question 4:
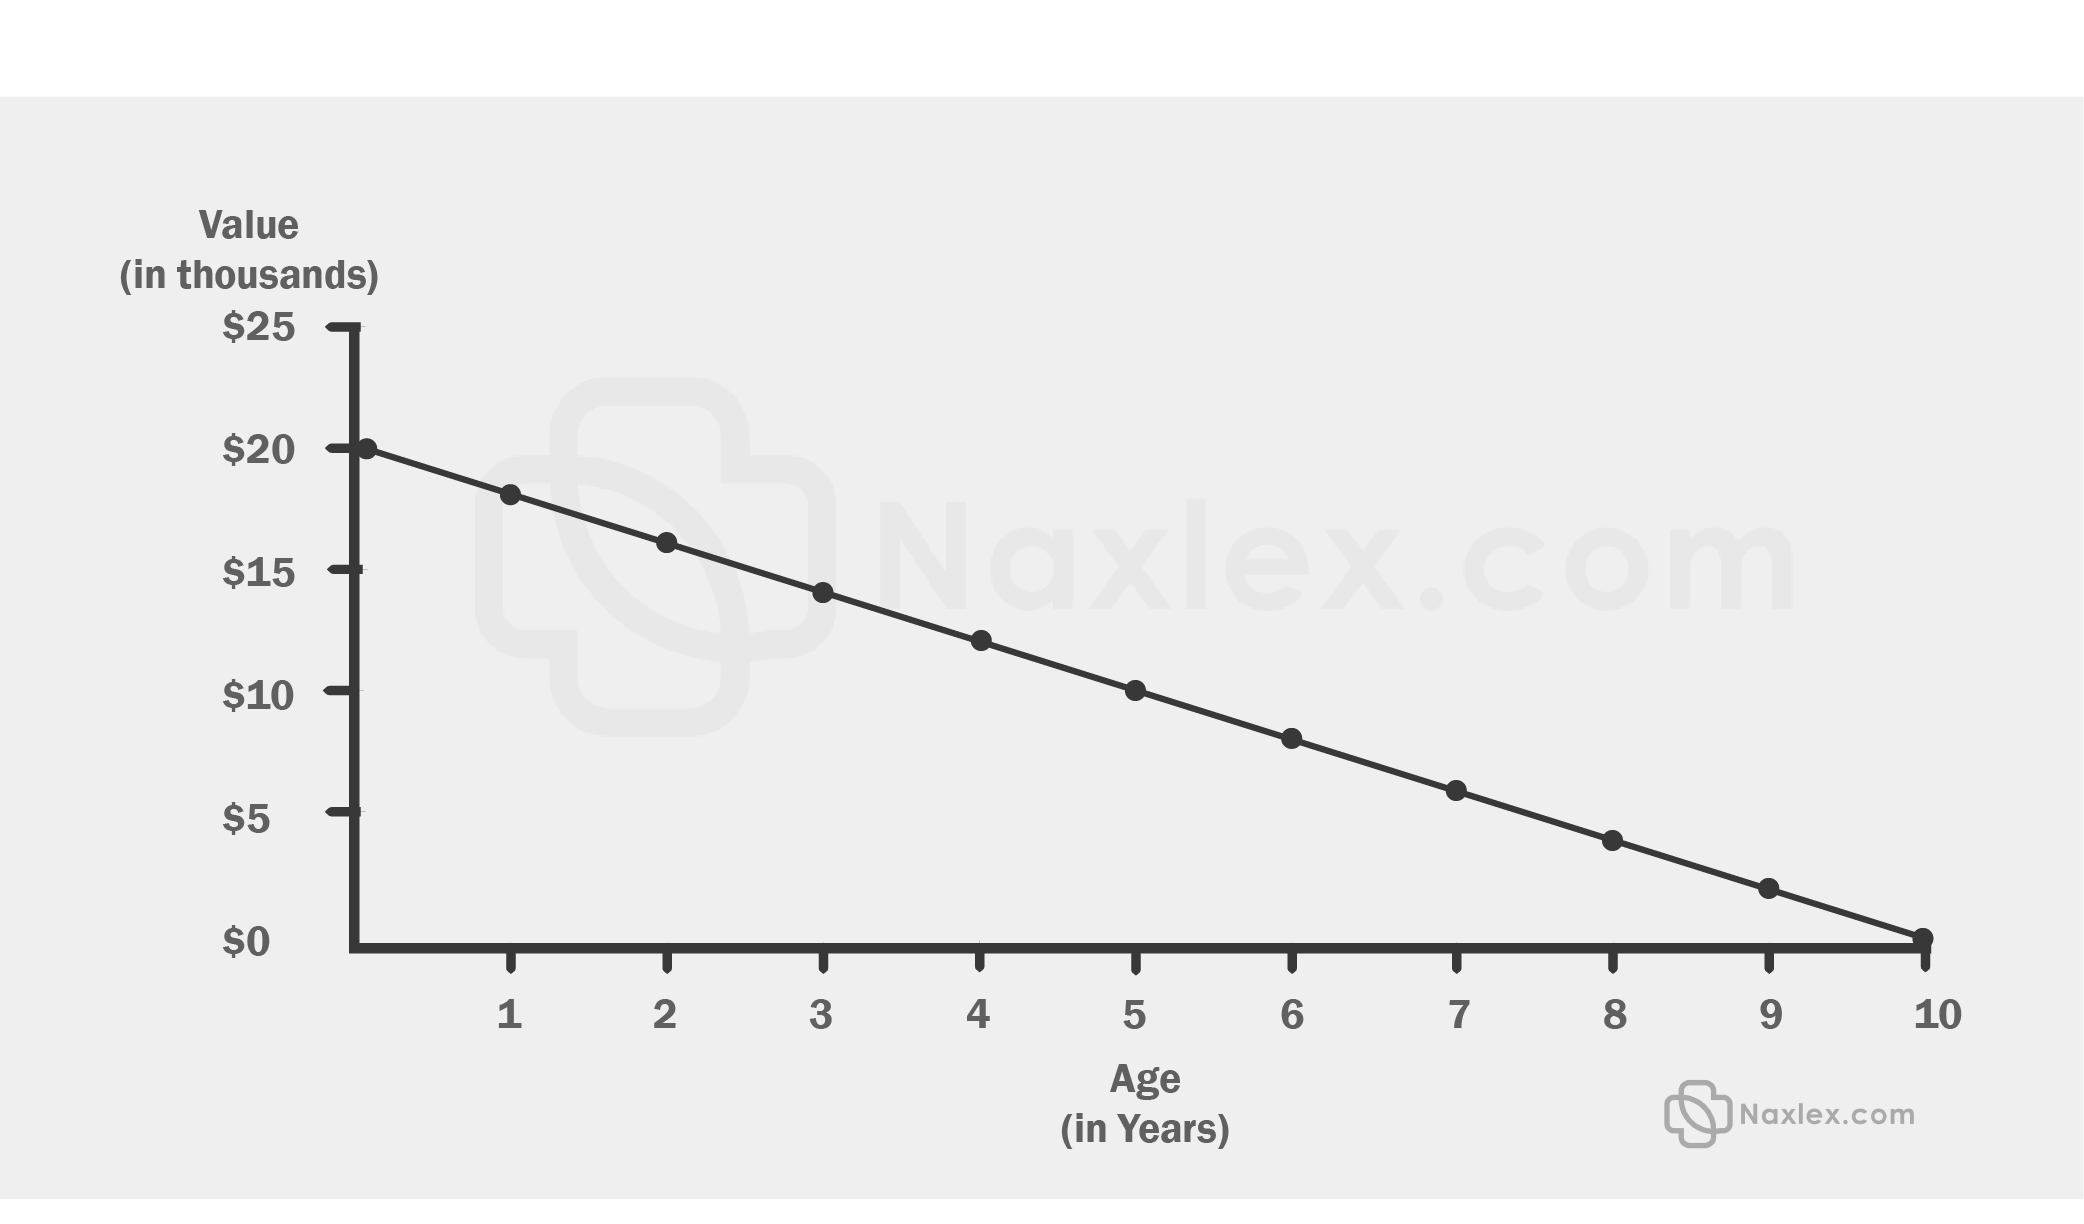
The graph below compares the age of car to its value. Which of the following is the age of the car when its value is $12,500?
A. Between 2 and 3 years
B. Less than 1 year
C. Greater than 3 years
D. Between 1 and 2 years
The Correct Answer is C.We extrapolate the values of a line between 10 and 15 on y-axis to meet the curve and drop another line from the intersection of the curve to meet the x-axis and read off the age of the car.
Now, let’s extrapolate in the following diagram
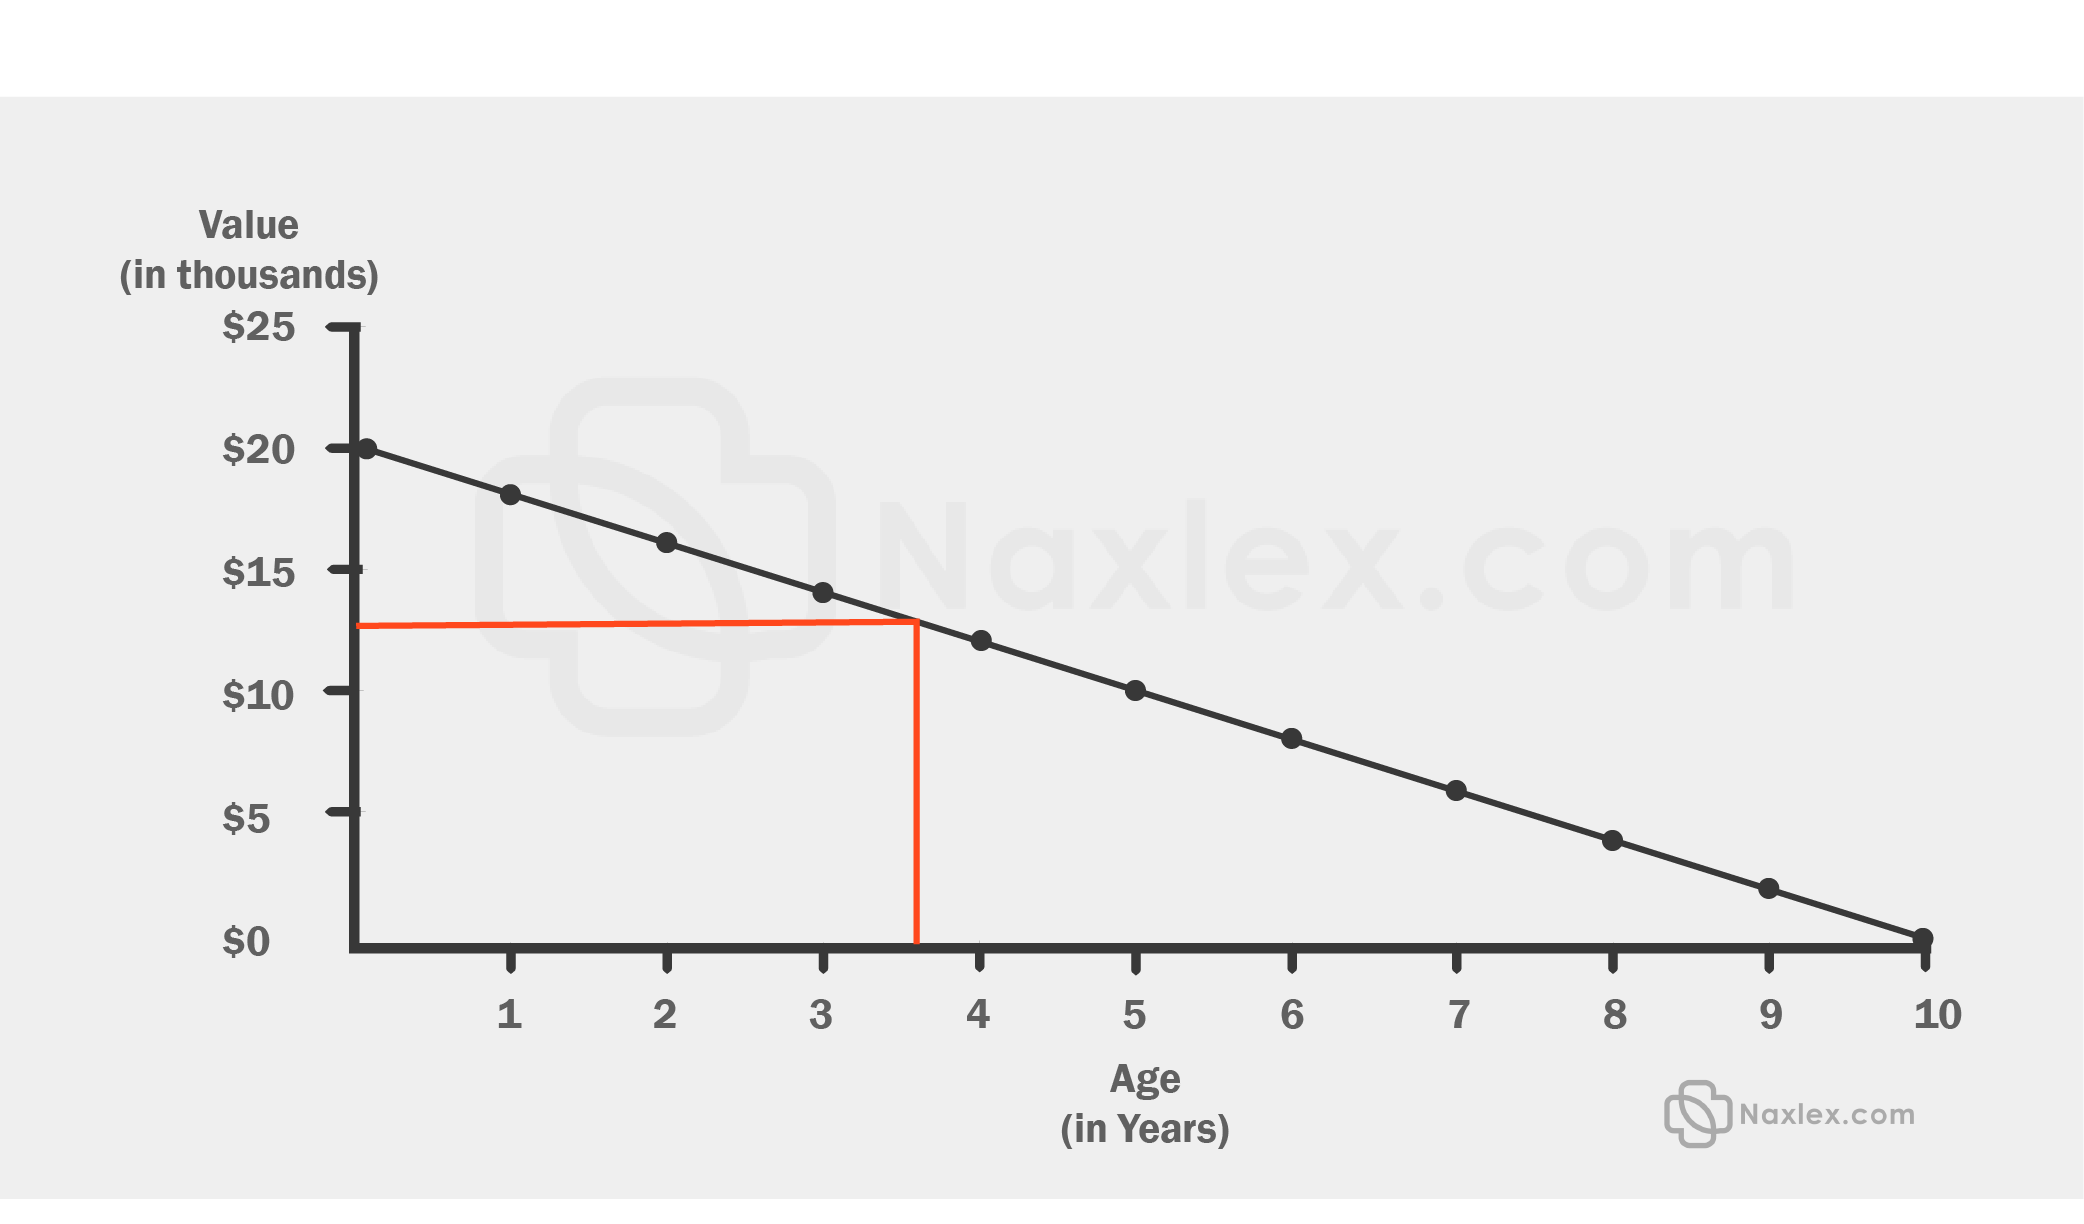
The intersection of the line and the x-axis is between 4 and 5 years. This means that the car is about 4.5 years old. From the options given, the age of the car is more than 3 years old.
Question 5:
For a school's annual budget, the total amount of money spent on supplies (s) and textbooks (t) cannot exceed $12,000. Which of the following inequalities represents this scenario?
A. s + t >= $12,000
B. s + t > $12,000
C. s + t < $12,000
D. s + t <= $12,000
The Correct Answer is D.We can interpret ‘cannot exceed” as less than ‘<’. Therefore, in our inequality, the symbol < must be included. Now let’s convert the word problem into a mathematical inequality.
Money spent on supplies=s
Money spent on textbooks=t
Total money spent=money spent on supplies + money spent on textbooks
Total money spent = s+t
But the money spent cannot exceed $12,000. Then,
s+t < $12,000.
However the money spent can still be equal to $12000, as it has not exceeded it.
Therefore, the required inequality is s + t <= $12,000.